Wetland Management System

INTRODUCTION
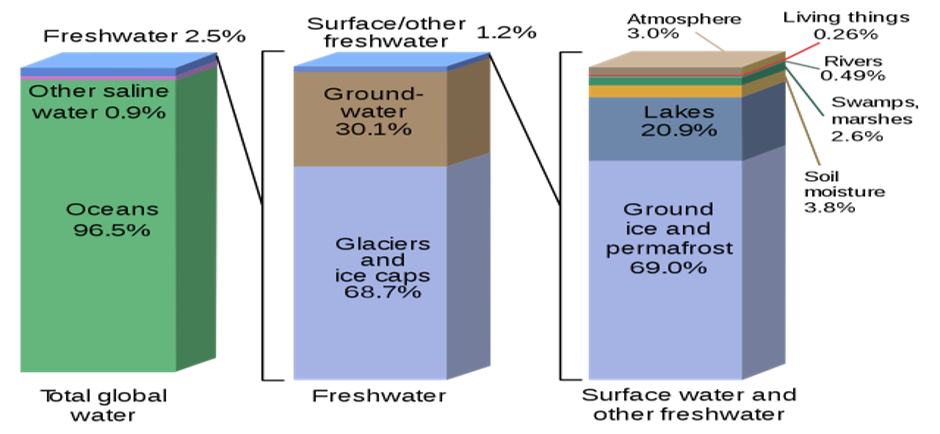
About 71% of the earth’s area is covered with water, of which only 2.5% of the total is freshwater that can be directly used for different purposes. The planet’s freshwater is very unevenly distributed, and most of the freshwater exists in the form of ice, snow, groundwater, and soil moisture, with only 0.3% in liquid form on the surface. Of the liquid surface freshwater, 87% is contained in lakes, 11% in swamps, and only 2% in rivers. Small quantities of water also exist in the atmosphere and living beings. Of these sources, only river water is generally valuable because the river drains nearly 75% of the earth’s land surface. If we talk about other freshwater sources, using them is a labor and energy-intensive process.
Declining water quality has become a global issue of concern as human populations grow, industrial and agricultural activities expand, and climate change threatens to cause major alterations to the hydrological cycle [2].
Globally, the most prevalent water quality problem is eutrophication, a result of high-nutrient loads (mainly phosphorus and nitrogen), which substantially impairs beneficial uses of water. Major nutrient sources include agricultural runoff, domestic sewage (also a source of microbial pollution), industrial effluents, and atmospheric inputs from fossil fuel burning and bush fires. Lakes, reservoirs, and wetlands are particularly susceptible to the negative impacts of eutrophication because of their complex dynamics, relatively longer water residence times, and their role as an integrating sink for pollutants from their drainage basins [2].
Earlier monitoring of these water parameters was very tedious and time and labor-intensive; water samples have to be collected, refrigerated, and brought to the labs for further analysis. It adds carbon footprint, the cost to the sample analysis, and some of the actual value may change in the meantime bringing a sample to the lab. But Arnowa has come up with an innovative solution, which uses IoT to monitor the different water quality parameters on a real-time basis. We have developed a system or Ecosystem which we called “JEEWAN” (meaning life). It consists of sensors for the various parameter, data storage & transmission protocol, cloud storage & computing, and a web-based user dashboard. “JEEWAN” is an entirely autonomous platform that transmits the real-time water quality data to remotely located user’s dashboard.
INNOVATION IN WATER QUALITY MONITORING IS NEEDED, WHY?
The excessive water challenges of our time, such as climate change, population growth, increasing urbanization, and aging and overly stressed infrastructure, impose significant pressure on water resources. The industry, and water-intensive needs to adapt to a dynamic and innovative approach in wastewater water management. In such an environment, water utilities also need to deliver essential services, including safe and secure drinking water, storm-water management and wastewater management.
Addressing these on-going and growing challenges requires a transformation to optimize its processes and operational efficiency. These challenges and their increasing complexity necessitate a paradigm shift to the next generation of water systems beyond traditional water monitoring and sewerage infrastructure. The development of new systems is against the background of cyber-physical systems, digitalization, and big data where software, sensors, processors, communication and control technologies are increasingly integrated, to enable informed decisions in an increasingly changing, complex and uncertain world [10].
HOW WE DO IT?
We offer a water quality monitoring platform called “JEEWAN,” consisting of sensors for many parameters (such as pH, Turbidity, TDS, etc.), which are connected to the wireless data transfer protocol through the nodes. Nodes send data to the Edge device which collect, filter, process, and sometimes store the data. The data generated are directed into the Cloud where storage and cloud computing get accomplished, converting the data into a usable form which are displayed on the dashboard. The dashboard can be accessed through the Web-based application provided by Arnowa on any device, anytime, and anywhere.
When the Big-data is generated through these sensors, we built models based on the Big-data analytics, AI, and machine learning to predict the future trend of the water quality at any specific location in time so that the water pollution can be prevented.
OUR OFFERINGS (HARDWARE & SOFTWARE)
- Water Quality Sensors
- Wireless Data Transmission Devices (Nodes, Gateway, Edge)
- Solar Panel and Battery for Island mode operation
- Arnowa Application Software
- Data Analytics Support (real intelligence)
PARAMETERS WE MEASURE
- pH: pH = -log10 [H+]. It is an essential indicator of water that is changing chemically because it can be affected by chemicals in the water. The pH of water determines the solubility and biological availability (the amount that can be utilized by aquatic life) of chemical constituents such as nutrients (phosphorus, nitrogen, and carbon) and heavy metals (lead, copper, cadmium, etc.) [4]. The pH of freshwater normally ranges from 6-8.
- Conductivity (EC): Conductivity is a measure of water’s capability to pass electrical flow. This ability is directly related to the concentration of ions in the water. These conductive ions come from dissolved salts and inorganic materials such as alkalis, chlorides, sulfides, and carbonate compounds.
- Salinity: Salinity indicates the saltiness or dissolved inorganic salt content in the water. Optimum salinity is essential for the osmoregulation of aquatic organisms. In unpolluted freshwater salinity remains below 0.05%.
- TDS: It indicates the total amount of solute or solid dissolved in the water. Salinity, Conductivity, and TDS all are related terms.
- Hardness: The simple definition of water hardness is the amount of dissolved calcium and magnesium and by a variety of other metals in the water. Hard water is high in dissolved minerals, largely calcium and magnesium [5].
- Turbidity: Turbidity is the measure of relative clarity of a liquid. It is an optical characteristic of water and is a measurement of the amount of light that is scattered by material in the water when a light is shined through the water sample. Turbidity is the most important factor in the growth of aquatic producers (phytoplankton). Material that causes water to be turbid include clay, silt, very tiny inorganic and organic matter, algae, dissolved colored organic compounds, and plankton and other microscopic organisms.
- DO: Dissolved oxygen is also a critical parameter of water that can predict or decides many other parameters of the water, such as temperature, BOD, COD, etc. It represents the amount of oxygen dissolved in water, which is very crucial to aquatic life.
- Temperature: It also affects several other parameters of water, such as DO, Conductivity, Salinity, TDS, etc.
- Toxic Elements: Elements primarily metals such as mercury, lead, arsenic, cadmium, are toxic to humans as well as for aquatic organisms. They must be measured because when their concentration exceeds, they enter the food chain and creates havoc.
- Alkalinity: It is the property of water which resists the change in the pH, so alkalinity is also called buffering capacity.
JEEWAN’S APPLICATION AREA:
- Wetland Monitoring: Pollution degrades wetlands and water quality. Wetlands act as a natural filter for polluted water, but they can only absorb so much. Pollution enters the water table through pesticides, sediment, sewage, fertilizers, and many other forms. Once a wetland is polluted, it’s difficult to clean it up. The best way to keep wetlands clean is to protect them from pollution in the first place by ensuring a contaminant-free water supply [1]. If the water quality parameter exceeds the permissible limit, JEEWAN will alert you through the alarm, text message, or email. So, the water may be diverted for proper treatment.
- Wastewater Treatment Plants/Sewage Treatment plant: These facilities treat Grey and Blackwater before they are released into freshwater streams or considered for reuse in other activities such as irrigation, construction, washing, etc. Arnowa’s water monitoring platform keeps proper insight into the wastewater quality parameter so that they meet strict criteria before they are released or used for other activities. They help the plant manager to make better decisions and in the management of quantum of wastewater.
- Aquaculture and Fisheries: Fishes are very sensitive to water quality parameters such as pH, DO, Alkalinity, Temperature, etc., so, this parameter should be properly monitored. A small change in any the parameter may result in the death of fishes, or sometimes the whole culture may be destroyed. Arnowa’s JEEWAN platform helps you to monitor these parameters on a real-time basis so that you remain stress-free, and the entire culture of fish can be saved from any damage.
- Agriculture: Irrigation water quality is a critical aspect of crop production. Among the most important water quality parameters are alkalinity, pH, and soluble salts. There are several other factors, such as calcium and magnesium, or heavy metals that can clog irrigation systems or individual toxic ions that will harm plants. Poor quality water can be responsible for slow growth, the poor aesthetic quality of the crop, and in some cases, can result in the gradual death of the plants. High soluble salts can directly injure roots, interfering with water and nutrient uptake. Water with high alkalinity can adversely affect the pH of the growing medium, interfering with nutrient uptake and causing nutrient deficiencies that compromise plant health [6]. These parameters can be easily accessed by Arnowa’s JEEWAN platform on a real-time basis so that you avoid damage to crops and prevent losses.
- Reservoirs/Dam/Lake Monitoring: Monitoring of these water bodies is necessary because they receive water from their catchment area. Anyone pollution source in the catchment areas will result in the pollution of whole water bodies. Arnowa’s JEEWAN water quality monitoring platform can be deployed near the catchment area, where it can detect and alert any deteriorating change in the water quality so the pollution source can be detected, and pollution of whole water bodies can be prevented.
- River Monitoring: It is a large water body formed when many small streams and tributaries meet and fed their water. As the rivers receive water from many different point and nonpoint source, they are more prone to be polluted. JEEWAN can be very helpful in identifying and mitigating the pollution source.
- Industries: Almost all industries require water for their operation at any stage of their production. After they have achieved their goal, they have to discard wastewater, but these industries have to follow some of the strict recommendations (such as pH, Temperature, TDS, etc.) from the government before dumping the water. JEEWAN platform is best suited for such kinds of applications as they will provide you these all parameters in real-time, so, that you can make decisions on when to release wastewater.
- Water Supply and Distribution: Apart from the open water bodies, the water supply, and distribution system can also be monitored using Arnowa’s JEEWAN platform. Using our smart water meter and JEEWAN platform, we have created a unique system which responds by closing the valves of water pipe when the water qualities go down the permissible limit.
- Integrated Water Resource Management (IWRM) and River Basin Management: IT tools can also be used at basin level to provide early warning systems, weather prediction as well as decision making for water allocation & river basin management. This includes [10]:
-
- Use of smart sensors and associated data to enhance the early warning system during extreme events such as flash flooding etc. besides also managing infrastructure and reservoir systems.
- Use of integrated monitoring and sensing system & data at river & canals to help in profiling the water flow and quality on a real-time basis and help undertake immediate interventions to curb water pollution; maintain flows and help address the upstream and downstream issues thus providing an opportunity for optimizing water allocation on a dynamic basis.
- Interlinking the real-time data on river and groundwater with a GIS platform can help identify several interventions in a synchronous way to effectively implement IWRM (integrated water resources management) at basin & watershed level.
- Groundwater: Collating and disseminating the information/data on groundwater level, aquifer status, and groundwater contamination for enhancing decision making for improved groundwater management.
BENEFITS OF WATER QUALITY MONITORING
- Reducing Climate Impacts through GHG Mitigation- Open water bodies are one of the main sinks for atmospheric CO2, which is a potent greenhouse gas. An increase in the temperature of water bodies reduces the solubility of gases. Monitoring the temperature of water bodies will help to mitigate climate change impact.
- Energy Use/Footprint Reduction- Proper monitoring of water bodies will prevent its pollution; hence, saving cost, energy, and labour on the purification of water.
- Help Reduce Water Pollution: JEEWAN water monitoring platform can quickly identify the source of pollution, so, further spread of pollutants can be prevented.
ABOUT ARNOWA
Arnowa is a smart real-time data acquisition, analytics, reporting, verification, and management system. Combined with artificial and real intelligence, Arnowa supports proactive monitoring, converting data to knowledge, predicting issues, periodic reporting, advising improvements, alarming and making informed business decisions. It involves a human interface, which provides proficient analysis of the information and knowledge stimulated out of the monitored data and converts it into wisdom that can be used for efficient decision making, improving the present as well as the future. Arnowa facilitates audit needs and improves management by providing transparency, accuracy, and useful advice.
Arnowa not only monitors and records data, but also provide a series of existing problems, diagnose the inefficient points, and provides solution to maintain efficiency levels through timely reporting and continuous support.
We help our clients improve asset performance at their businesses by offering improved efficiency through proactive energy, water, and environment management. We enable you to keep track of your assets and get real-time insights from anywhere around the world. Our team of expert professionals will be guiding you with timely recommendations on efficiency improvements and supporting your business in times of need to make the right choices.
REFERENCES
[1] Debra Ronca. Threats to Wetlands. How Wetlands Work. Link: https://science.howstuffworks.com/environmental/green-science/wetland3.htm
[2] United Nations Departments of Economics and Social Affairs (UNDESA), 2014. International Decade for Action “Water for life” 2005-2015. Link: https://www.un.org/waterforlifedecade/quality.shtml
[3] https://en.wikipedia.org/wiki/Water_distribution_on_Earth
[4] United States Geological Survey (USGS). pH and Water. Water Science School. Link: https://www.usgs.gov/special-topic/water-science-school/science/ph-and-water?qt-science_center_objects=0#qt-science_center_objects
[5] United States Geological Survey (USGS). Hardness of Water. Water Science School. Link: https://www.usgs.gov/special-topic/water-science-school/science/hardness-water?qt-science_center_objects=0#qt-science_center_objects
[6] The Center for Agriculture, Food and the Environment (CAFE). Water Quality for Crop Production. The University of Massachusetts Amherst. Link: https://ag.umass.edu/greenhouse-floriculture/greenhouse-best-management-practices-bmp-manual/water-quality-for-crop
[7] United States Environmental Protection Agency (UNEPA). Climate Action Benefits: Water Quality. Link: https://www.epa.gov/cira/climate-action-benefits-water-quality
[10] Energy and Resource Institute (TERI), 2019. ICDL 2019 DIGITAL TRANSFORMATION FOR SDGs.


